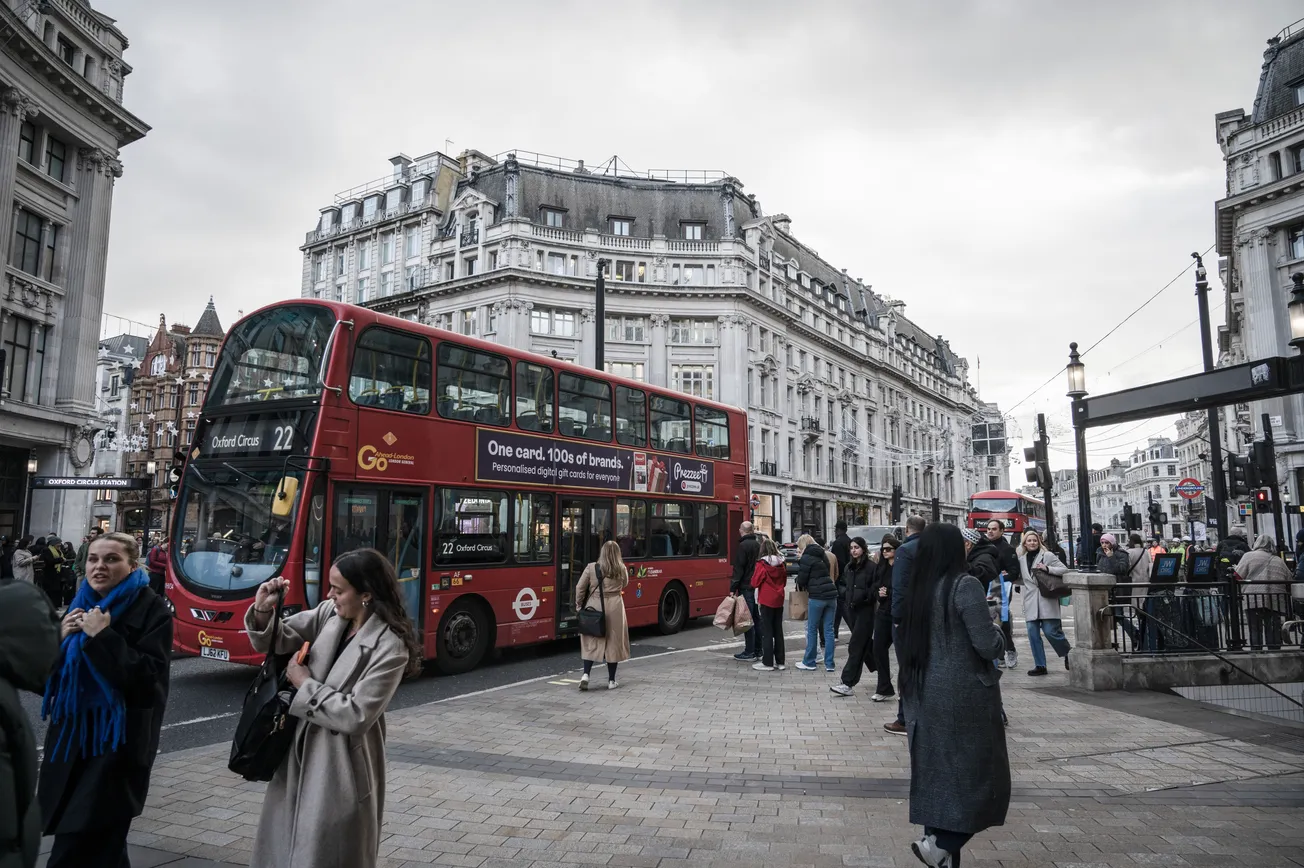
The 108 is a great bus. Free to use until 2026, it will take you from Lewisham station to Stratford in 36 stops. It has been running, in one way or another, since before the First World War, taking riders under the Thames through the Blackwall Tunnel, right below the O2 Arena, and to the Olympic Village in Stratford.
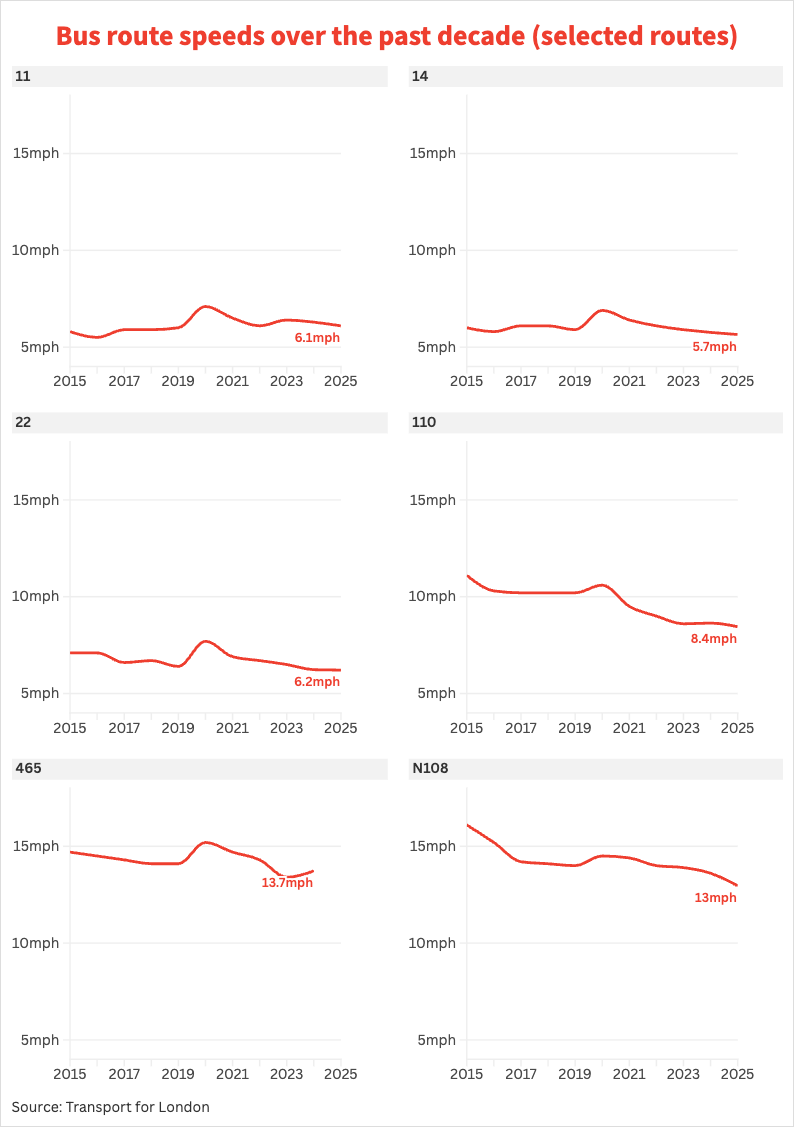
But the night version, which runs between 23:00 and 06:00, is also the bus that has slowed down the most over the past ten years: while it used to run at 16.1 miles per hour in 2015, that has dropped to 13 mph, slowing by over 3 miles per hour in a decade.
You may not ride the 108, but the chances are you’ve noticed your bus slowing down. Almost three quarters of London’s bus routes are now slower than they were a decade ago, according to our analysis of Transport for London data. Out of 748 active routes across Greater London, 555 (74%) have seen a drop in average speed since 2015. The 110 (which runs between Hounslow and Hammersmith) has slowed by almost 2.65 miles per hour over ten years. To put that in perspective: going from Kew Gardens station to Richmond station (about 1.4 miles on the 110) would have taken around 7 minutes and 30 seconds in 2015. In 2025, that's gone up to 10 minutes.
Want to see how your route is faring? Use our interactive tool here to explore the average speed of your bus over the last ten years.
But why are most buses getting slower? “The volume of traffic is greater nowadays,” says Chris Barker, chair of Future Transport London, part of the London Bus Alliance – a campaign group formed in 2021 to reverse the decline in bus ridership.
At first glance, that’s surprising, as the number of licensed vehicles in London has fallen. According to Department for Transport data, there were just under 3 million vehicles in the city in 2023, the lowest figure since 2013. There’s also been development of the underground network, most obviously the Elizabeth Line, which should be taking cars off the road.
But the cars that are on the road are spending more time there, thanks to Uber (and others). “There are more hire vehicles now, like taxis and ride-hailing services, so even though there are fewer cars overall, they’re circulating much more,” Barker tells The Londoner.
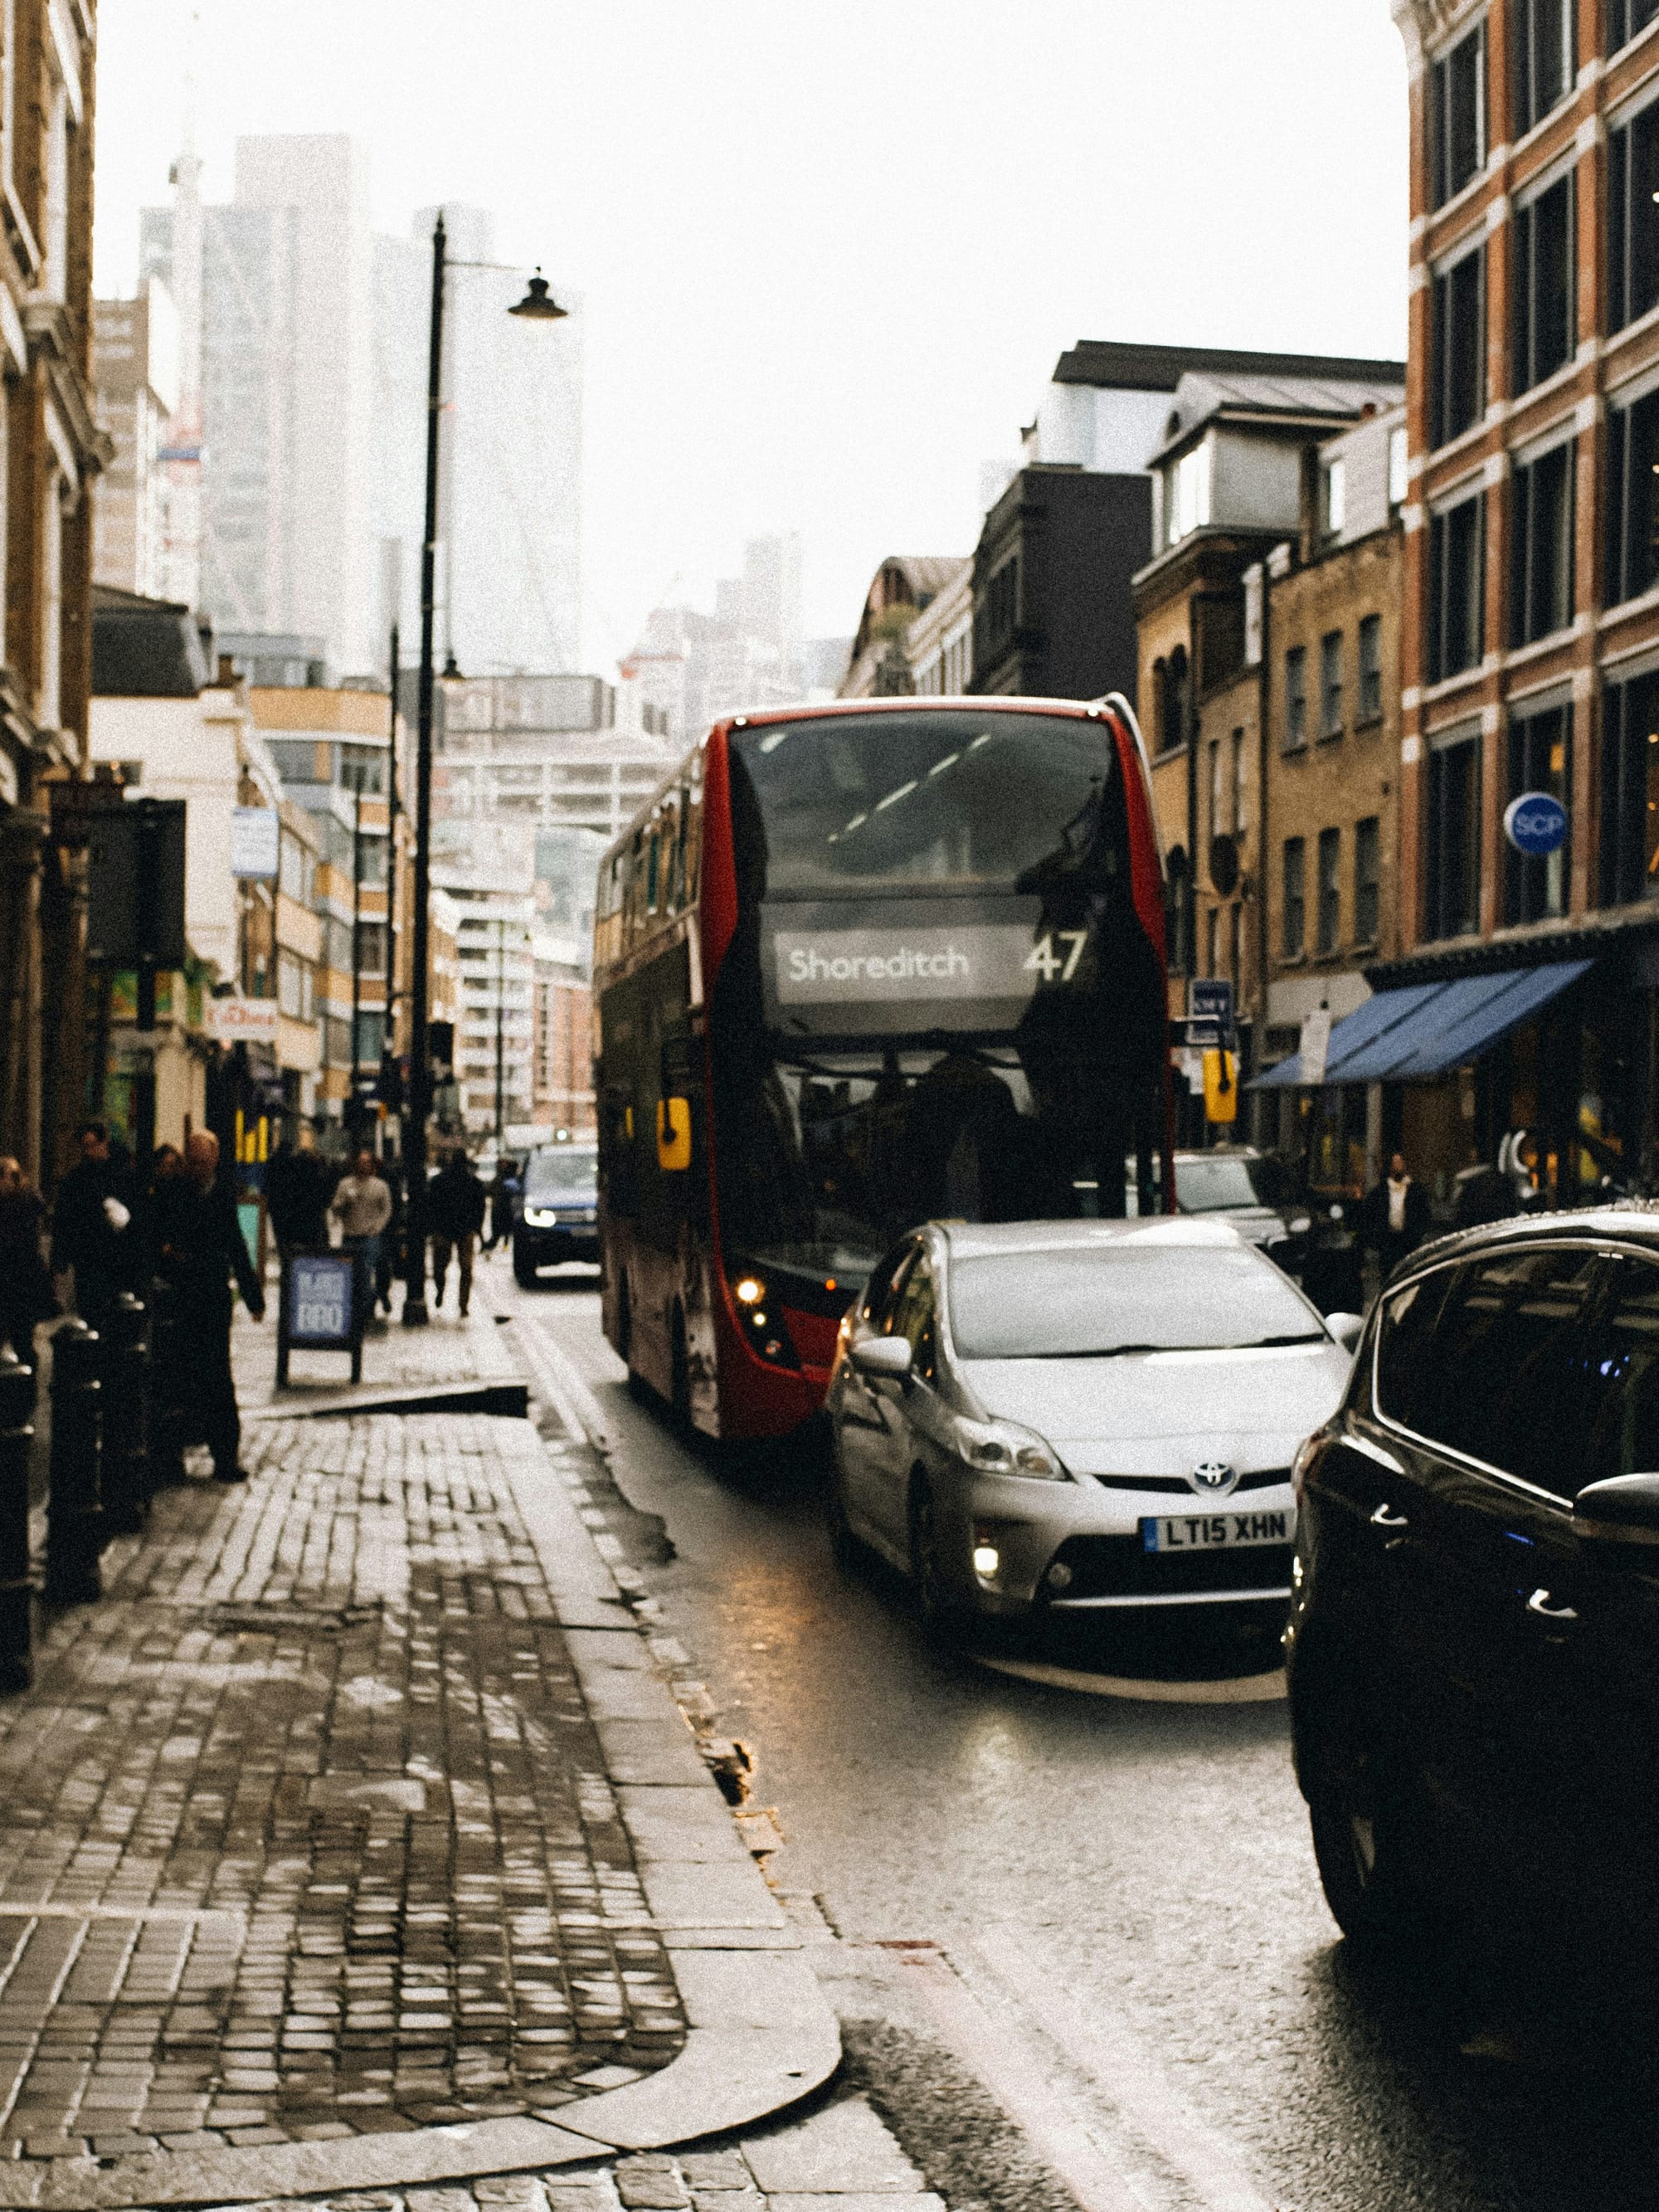
Barker also points to narrower bus lanes, sometimes reduced to make room for cycle infrastructure, and constant roadworks as other culprits. “Roadworks are a huge problem,” he says. “They take up road space and often introduce temporary traffic lights, which slow everything down.”
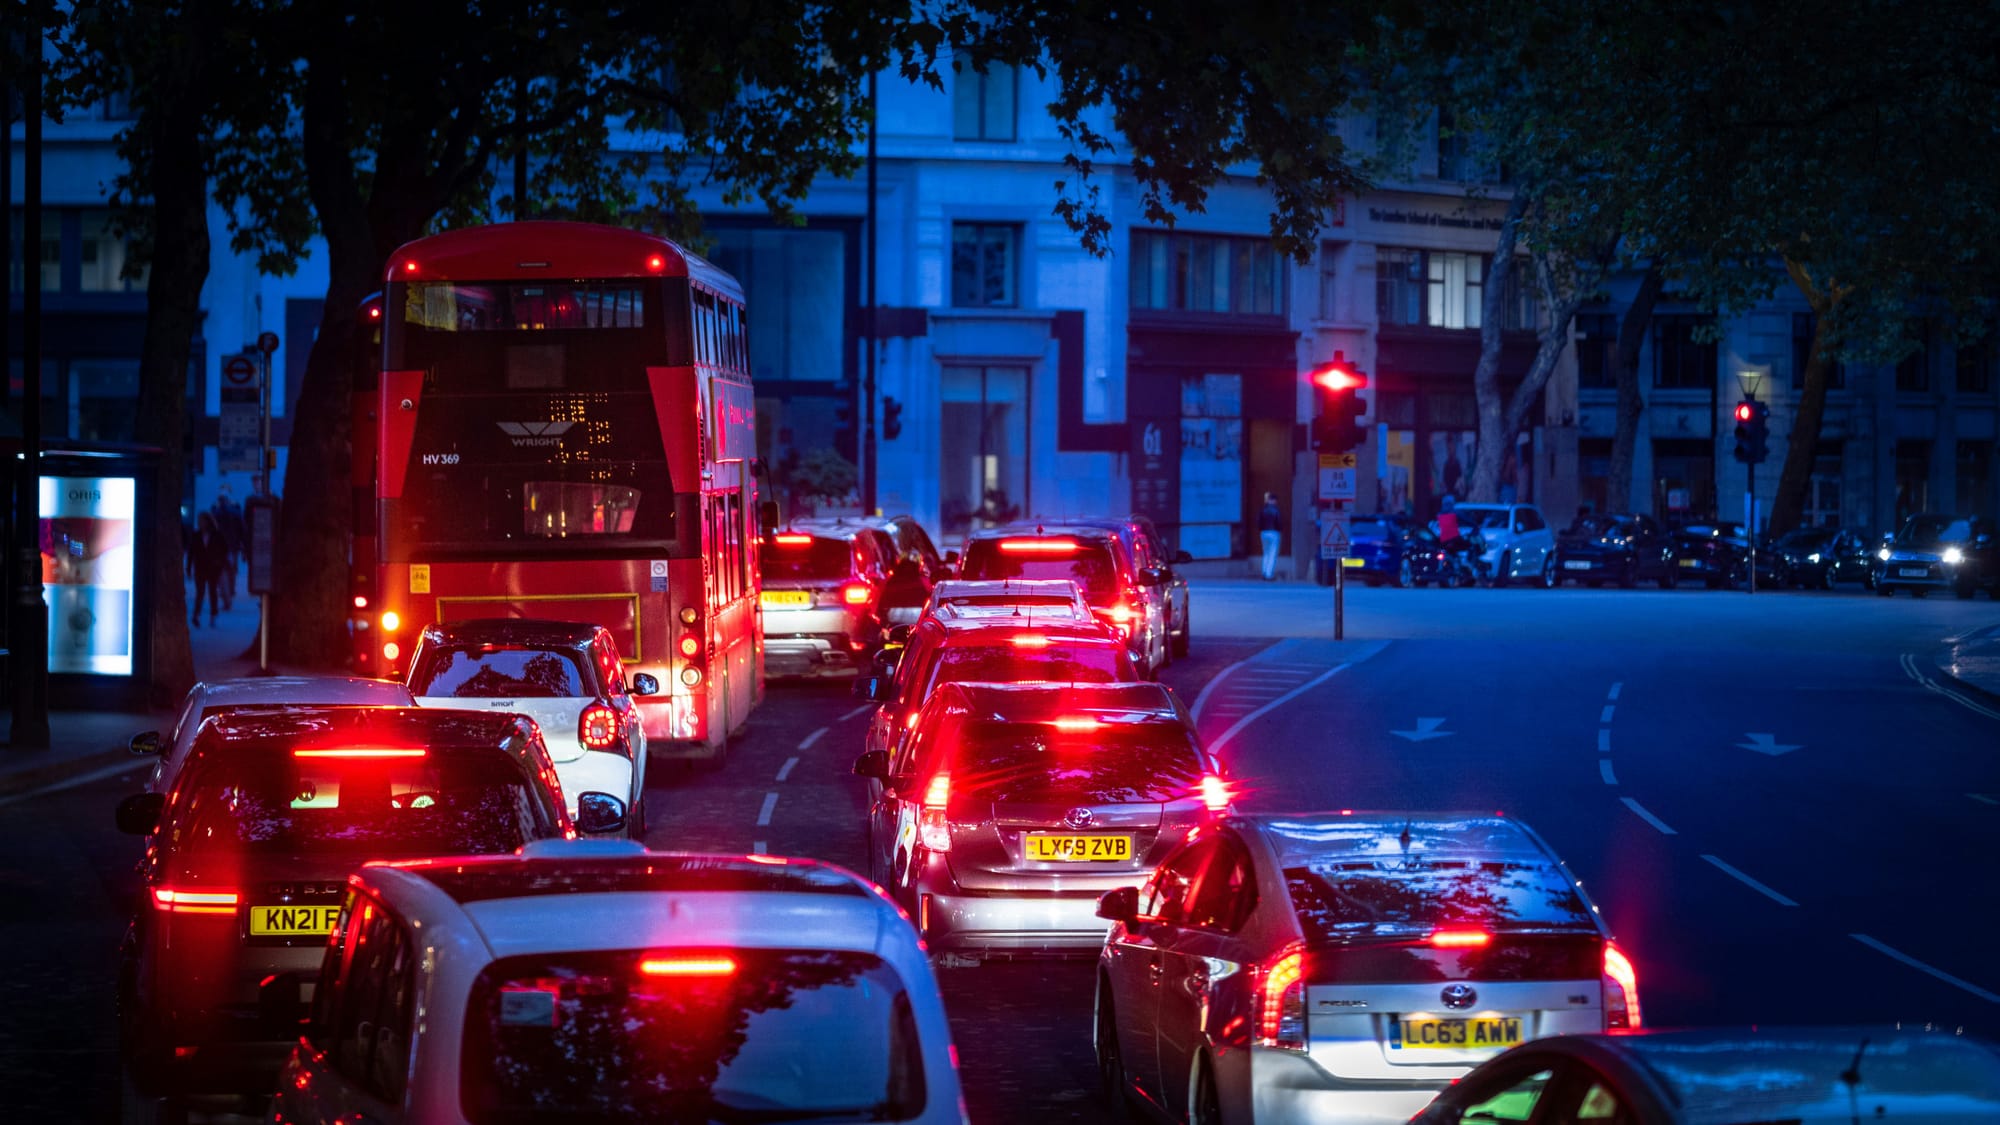
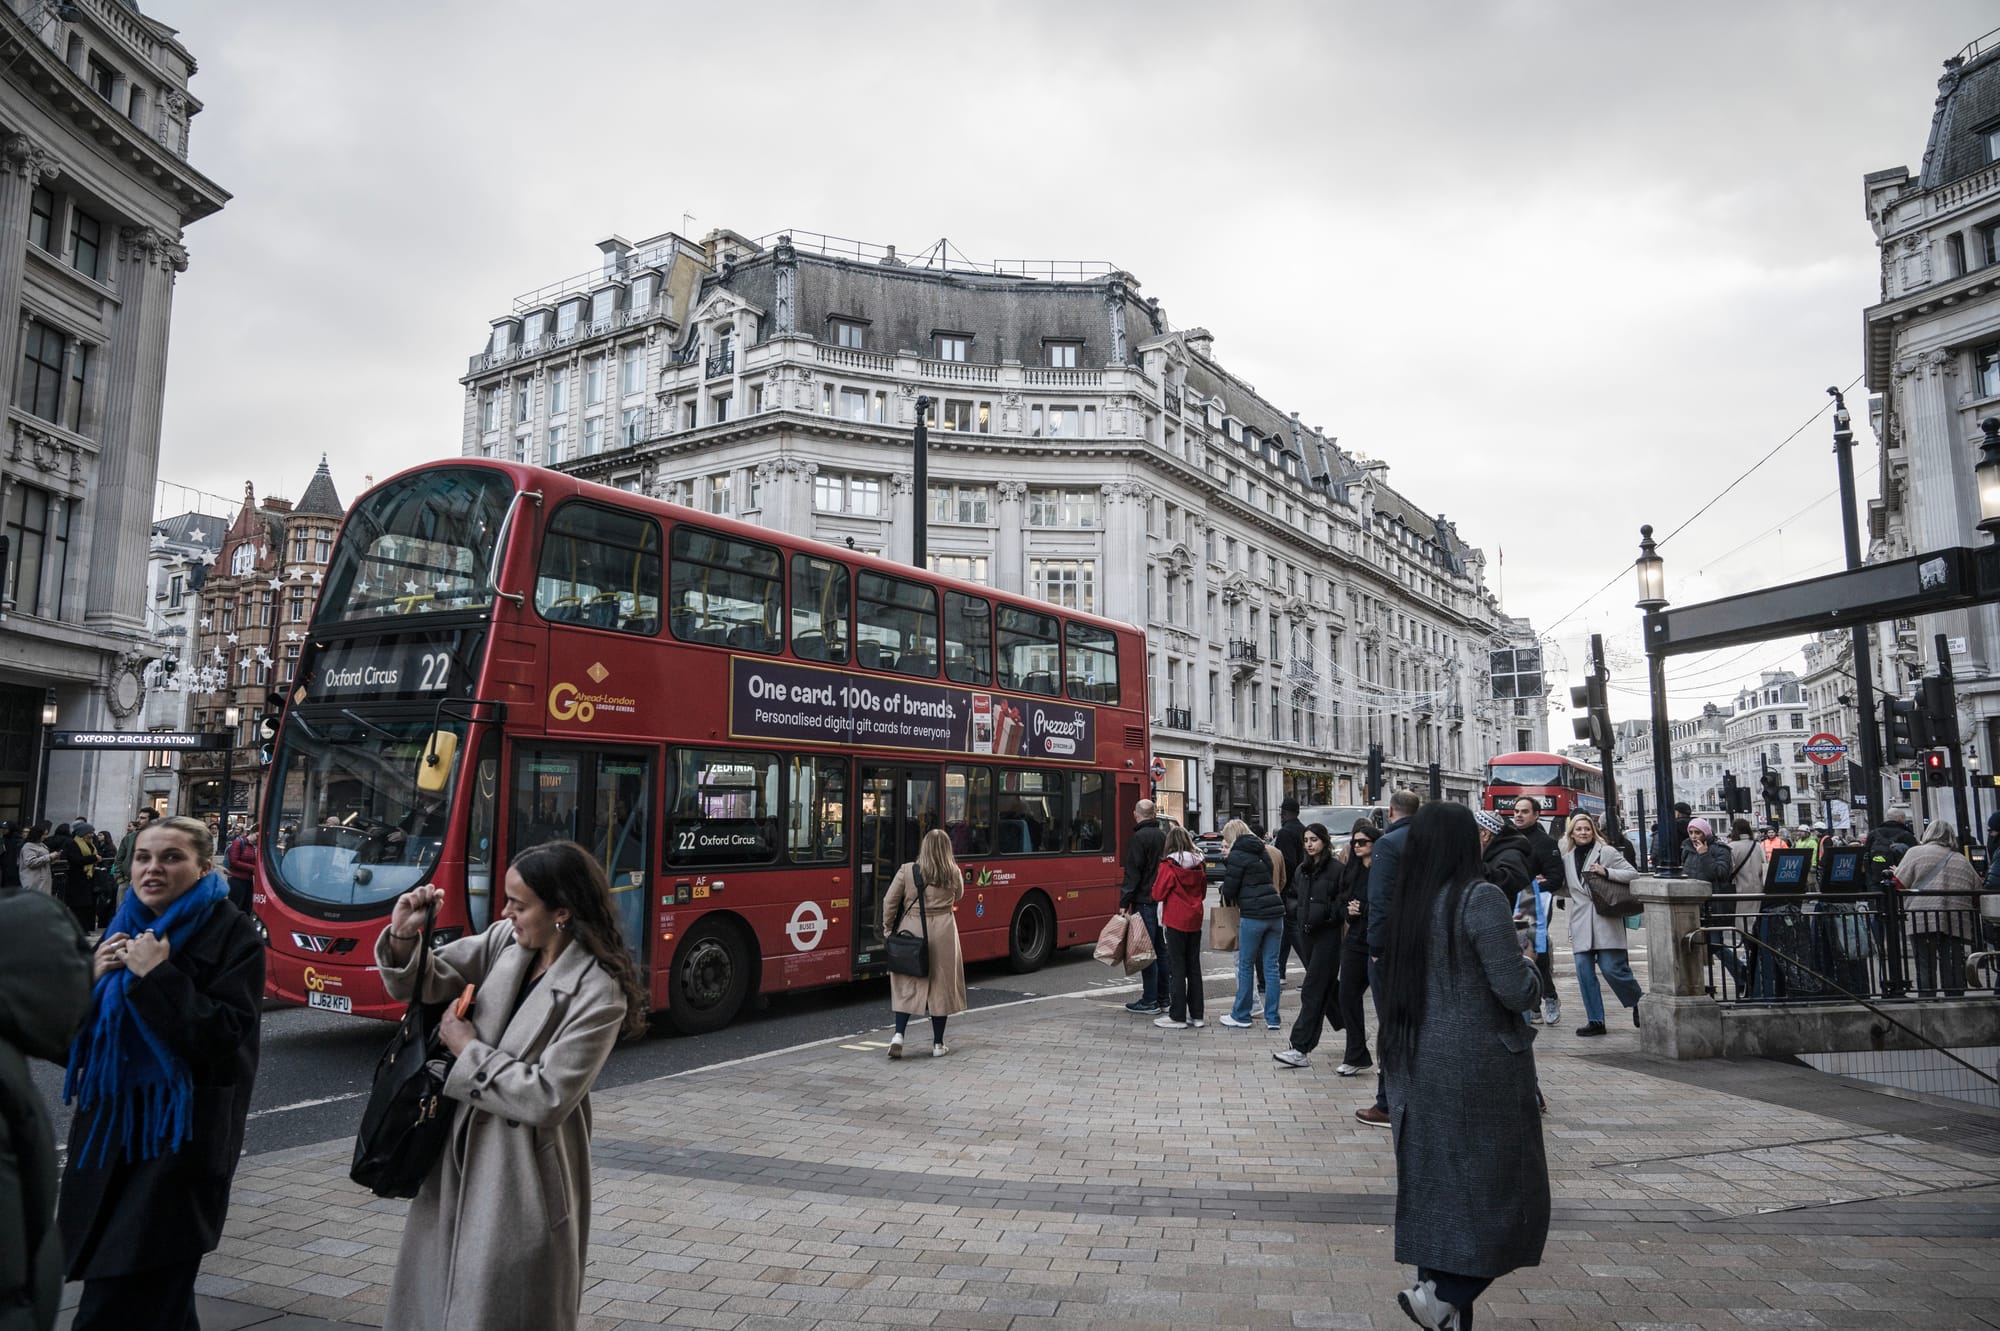
All of this combines to make driving through London increasingly difficult. According to TomTom’s 2024 Traffic Index, the city centre now holds the title of Europe’s slowest. On average, it took 32 minutes and 8 seconds to travel six miles in 2024, 38 seconds slower than the year before.
Buses are a staple of London’s public transport system: 34% of Londoners use the bus at least three times a week, more than any other mode of transport, according to a London TravelWatch report published in November 2024. 1.8 billion journeys were made by bus in London last year, with people on lower incomes and women tending to use them more than other passengers. At £1.75 a ride, they’re the cheapest form of transport.
Because they’re such an integral part of urban life, it’s a big problem when they slow down: they’re seen as less reliable and fewer people use them. That in turn makes it harder for people to access jobs, and reduces quality of life if people are spending more time shunting through crawling traffic.
TfL have been aware of the problem for a few years. “There has been a clear correlation between declining bus demand and deteriorating average bus speeds. Many of these journeys will instead be made by car or not be made at all, both bad outcomes for local economies,” TfL wrote in their 2022 Bus Action Plan. According to them, a 10% increase in journey time could lead to a 6% drop in usage.
To tackle the issue, TfL pledged to introduce 25km of bus lanes by 2025, and to double down on fines for people parking in them; something it views as a major cause of delays. The goal was to make buses 10% quicker by 2030 (compared to 2015 levels). But so far, the opposite has happened: on average London’s buses have slowed by nearly half a mile per hour since 2015.
In May, The London Bus Alliance raised concerns that progress was too slow: “Bus journey times had been hitting historic highs, which resulted in many people experiencing unreliable and slower services, making buses less inclusive and attractive to use,” they wrote, adding they were “concerned that TfL was unable to meet its own deadline of creating 25km of new bus lanes by March 2025, which will only now be done by December 2025.”
The picture by borough
Buses may be slower than ever, but speeds vary significantly depending on where you are in the city. During the pandemic, when everyone was homebound and the streets were empty, buses zipped along at speeds not seen in years. The 14 – London’s slowest bus today, averaging 5.7 mph in 2025 – was going at 6.9 mph in 2020, the fastest it had been in a decade.
In these post-pandemic years, it’s no surprise that more densely populated areas of the city, where traffic jams are more frequent and traffic lights are everywhere, tend to have slower buses. This year, the slowest routes on the network (the 11, 14, 22 and 26) all averaged around 6 mph and all passed through London’s slower, inner boroughs. The average bus speed over the past year in the City of London, for example, was 6.2mph. In Bromley, it was almost double that.
City authorities, including the Mayor and Transport for London (TfL), are clearly aware of this. Most of the recent efforts to improve bus speeds, such as introducing new bus lanes, have focused on central areas, where taking the bus is often barely quicker than walking. According to London TravelWatch’s 2024 report, two-thirds of all bus lane kilometres are in the inner boroughs, while outer boroughs have significantly fewer routes with priority lanes.
But while it’s true that central London suffers from the slowest speeds, some of the biggest slowdowns have been in outer boroughs.
For example, Richmond upon Thames has seen the largest drop in bus speeds over the past decade, according to our analysis of TfL’s borough-level data. In 2015, buses in this western outer borough ran at an average speed of 11.1 mph. In 2025, that figure has fallen to 10.1 mph, an 8.8% slowdown. Four of the five boroughs with the biggest slowdowns are in outer London.
Dawdling buses are bad for everyone – businesses who see workers arriving late more often and the commuters who have to endure the misery. The extra bus lanes being brought in seem to be fighting a losing battle against the on-demand car services filling to roads. If buses are to get faster again, a more radical approach to how London's roads are used might be needed.